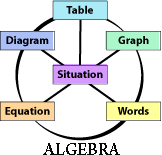
The Project TIAN mathematical content centers on two strands of mathematical proficiency: algebra and data. Participating teachers and their students learn by investigating the patterns and mathematical information found in real-life situations.
Learning Goals for Students and Teachers
Data and Graphs

- Collect, organize, and represent data
- Make accurate statements about data using percents and fractions
- Create and interpret frequency graphs, bar graphs, circle graphs, and line graphs
- Make predictions, decisions, and recommendations from information presented in bar, line, and circle graphs
- Use scale to change the story a graph tells
- Interpret graphs with different scales
- Use mean and median to describe a data set

Algebraic Thinking
- Identify patterns and predict outcomes in a variety of situations
- Describe patterns and relationships using a variety of representational tools: diagrams, words, tables, graphs, and/or equations
- Understand how the different representations are related
- Recognize the characteristics of linear patterns
- Use and understand basic algebraic notation
