Where in the World Is It Hot? Where Is It Cold?: A Data Excursion for Grade 5
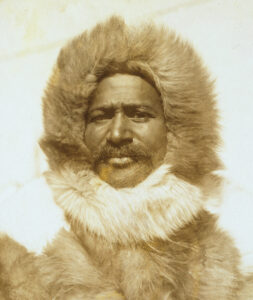
Students consider Mystery Graphs that show temperature over time in places with extremes of cold and heat. They learn about Matthew Henson, the African American explorer who participated in Robert Peary’s 1908–09 expedition in the search for the North Pole. Students consider some of the temperatures he recorded in his journal during that expedition. Finally, students pick a place in the world that has some meaning for them or their family. They find and graph average monthly temperatures for that place and write a brief story about their connection to that place. The excursion ends with an exhibit or presentation of students’ work.

This Excursion involves 5 activities, to be done in sequence, and includes links to reproducible resources and a Slide Deck.
Students consider Mystery Graphs that show temperature over time in places with extremes of cold and heat. They learn about Matthew Henson, the African American explorer who participated in Robert Peary’s 1908–09 expedition in the search for the North Pole. Students consider some of the temperatures he recorded in his journal during that expedition. Finally, students pick a place in the world that has some meaning for them or their family. They find and graph average monthly temperatures for that place and write a brief story about their connection to that place. The excursion ends with an exhibit or presentation of students’ work.

This Excursion involves 5 activities, to be done in sequence, and includes links to reproducible resources and a Slide Deck.

Want to be notified when resources become available, events are announced, or blogs are published? Sign up here!
Share This Page: