Teens and Time Module
Teens lead busy lives, but how do they divide their time among school, sports, volunteering, chores, work, leisure, and sleep? Do boys and girls differ in how they spend their time? How about older teens and younger teens? Do teens in different parts of the country use their time differently?
In this module, Data Clubs participants get a taste of what it’s like to be a journalist, policy maker, or scientist looking for patterns in data, as they:
- collect data on their own time use;
- critically analyze data visualizations from articles; and
- ask their own questions of two big public datasets.
Participants compare two different methods of data collection. For one, they keep a time use diary over a 24-hour period. For the other, they answer survey questions about how many hours they spend per week on activities ranging from sleep, to homework, to screen time. Students compare data based on age, gender, and even how much school pressure they say they feel. Then they consider how these two methods of data collection might offer different perspectives on time use.

Participants can also take on a data collection project working in groups to define the attributes they want to examine, select a data collection methodology, and design their own non-traditional data representations. They learn to think carefully about:
- how time use is measured;
- what questions can be asked of the data;
- what questions go beyond the data; and
- how data visualizations can provide insight about interesting data patterns.
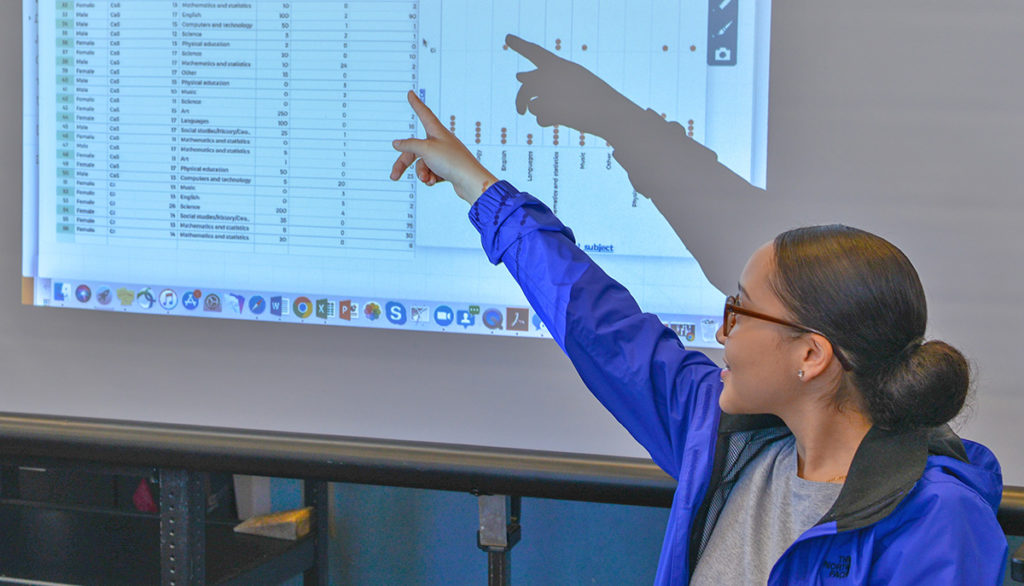
Learners use a variety of tools for interacting with and visualizing their data, including their bodies, Post-Its, “case cards”, and CODAP, a free online data platform for exploring big datasets.
Participants discover that data are everywhere, that multiple questions can be asked of the same dataset, and that graphing is a tool that can be used creatively to explore questions and discover patterns.
The module is available for interested educators by filling out the form below.
