Free Resources for Educators
Teachers and researchers are collaboratively developing resources and activities to support data inquiry in social studies classrooms. Once these are ready, they will be posted here and free for educators to access and use. Join our list to get notified when new resources are posted and get access to datasets as they are developed.
Resources for Educators
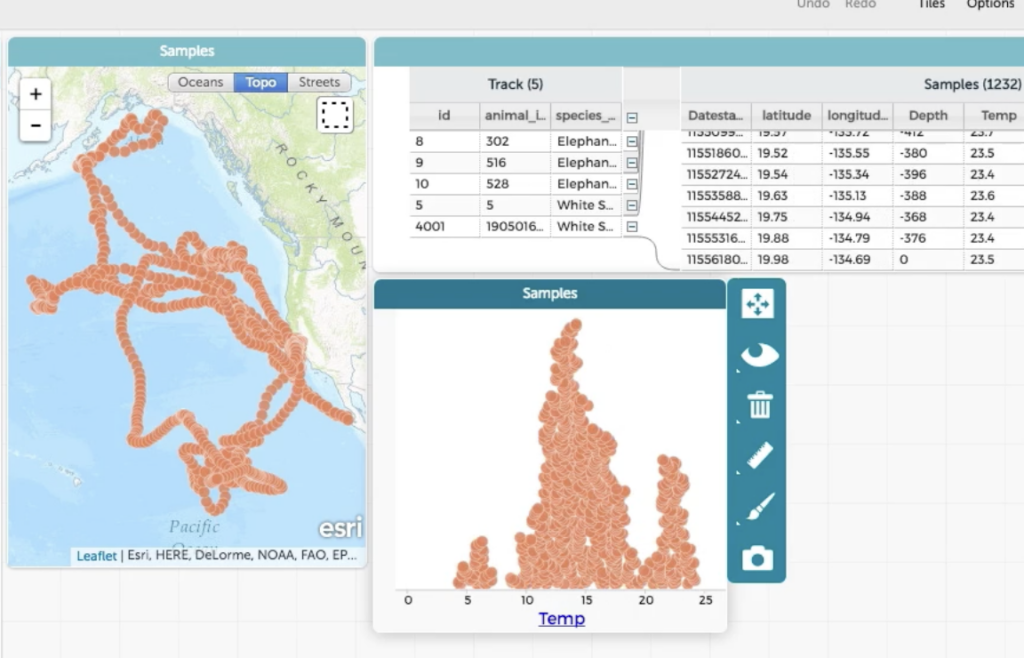
CODAP (Common Online Data Analysis Platform) is an easy-to-use data analysis environment designed for grades 5 through 14. CODAP can be used across the curriculum to help students summarize, visualize, and interpret data, advancing their skills to use data as evidence to support a claim.
Your students can load their own data into an easy-to-use web-based data analysis tool to create their own datasets, share visualizations, and discover data-driven insights. In the process, they will learn to understand the world through its data. Visit: For Educators: Teaching with CODAP
The Civic Data Project is curating datasets for educators to use in CODAP with students. Data sets that are now available include:
- County Health and Well Being Data for New England
- Youth Voting Behavior by State for 2022 Midterm Elections
- EPA Environmental Dataset for RI with Towns/Cities
- Exploring the World with United Nations and Gallup Poll Data
Join our list and to request and get access to these datasets. We will send you a follow up email soon with the access to these.

Additional Resources for Educators
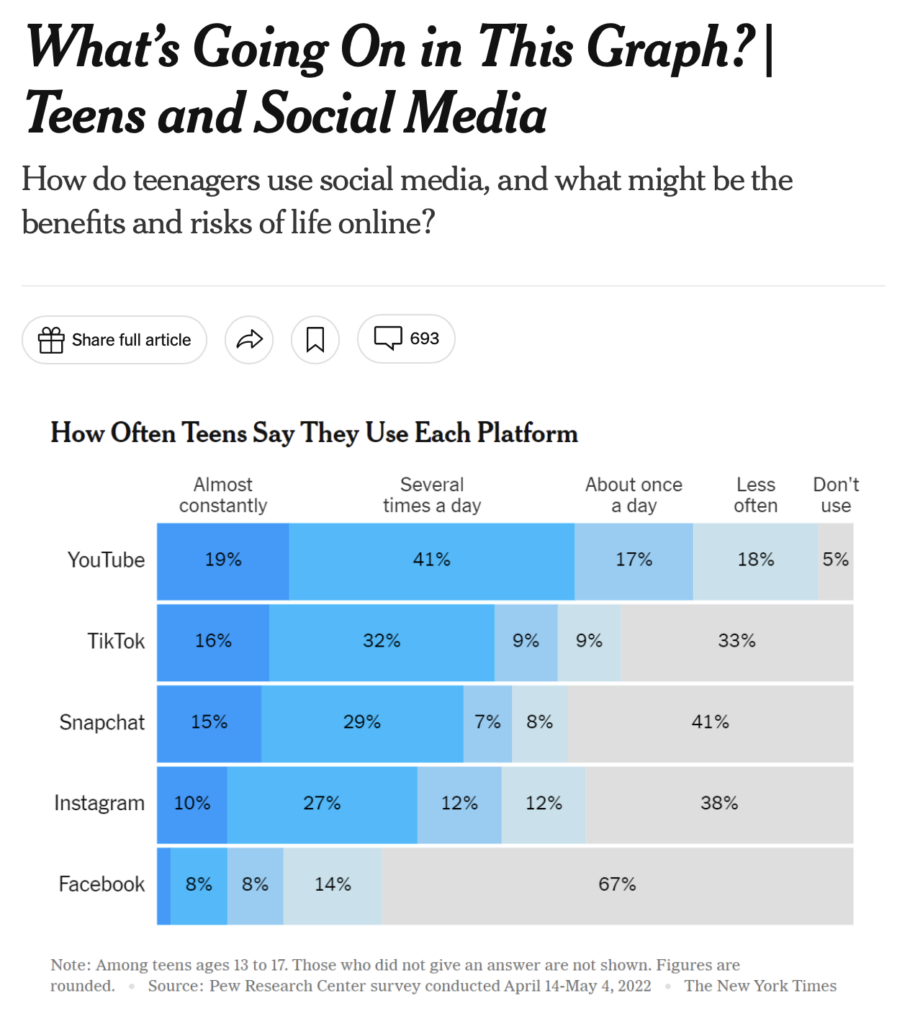
What’s Going on in this Graph? Every week during the school year, a different graph, map or chart is shared from The New York Times and students are invited to share what they notice and wonder about it. Teachers have reported that this feature exposes students to a variety of graph types and concepts in math and statistics in a real-world context, and that it gives students a way in to analyze and understand the visual journalism produced by The New York Times. Want to learn more about this feature? Watch this short introduction video and start using New York Times graphs in your classroom.
Slow Reveal Graphs: (#slowrevealgraph) is an instructional routine that promotes sensemaking about data. This highly engaging routine uses scaffolded visuals and discourse to help students (in K-12 and beyond) make sense of data. As more and more of the graph is revealed, students refine their interpretation and construct meaning, often in surprising ways. This routine increases access for students without sacrificing rigor or engagement. Visit: Resources for the Classroom.
Gapminder: Gapminder identifies systematic misconceptions about important global trends and proportions and uses reliable data to develop easy to understand teaching materials to rid people of their misconceptions. They have created tools that are designed to be simple, good to look at and are ideal to explore in the classroom. See how people live on different income levels on Dollar Street and use their tools to explore global, regional and country-level data on lots of different subjects. Visit: Teaching Materials
Questions? Please contact us.


