Will This Be on the Test? (March 2025)
by Aren Lew
Welcome to the latest installment of our monthly series, “Will This Be on the Test?” Each month, we’ll feature a new question similar to something adult learners might see on a high school equivalency test and a discussion of how one might go about tackling the problem conceptually.
Welcome back to our continuing exploration of how to bring real conceptual reasoning to questions students might encounter on a standardized test.
Reading and making sense of charts and graphs is important on the math section of high school equivalency and other standardized tests, and it is also important on the science and social studies sections. The reason it shows up in all three of those places is that data literacy is essential in the world beyond the test. Data and representations of data are everywhere in our lives, and it is crucial that students learn to pay close attention to and ask good questions about data displays.
Here’s a question that provides an opportunity to use some data reasoning skills:
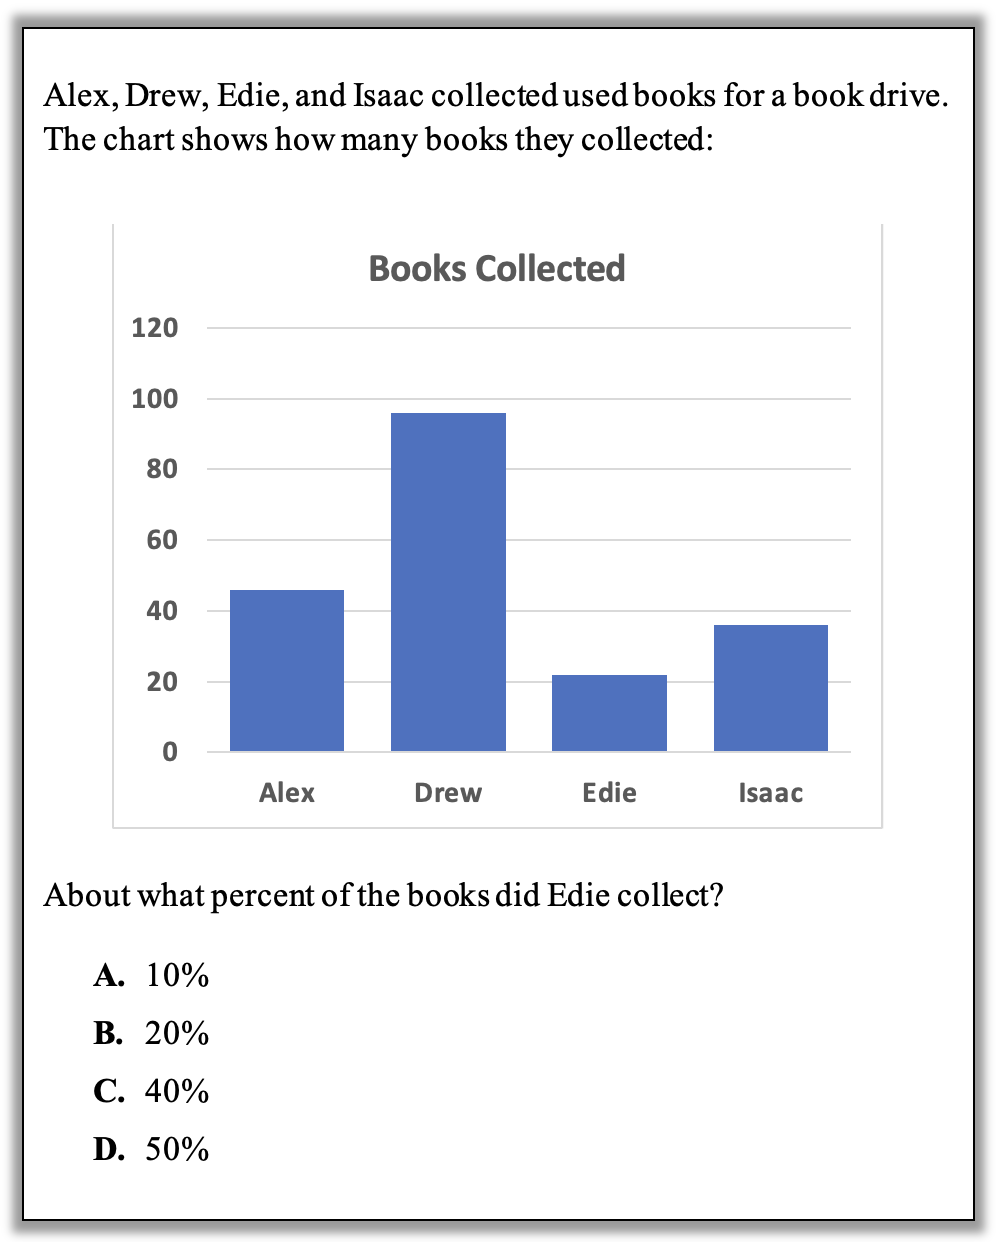

How can you approach this question in a way that makes sense to you? What conceptual understandings or visual tools can you bring to bear? What mathematical concepts do students really need to be able to tackle this problem? How might your real-world experience help you reason about this?
Here are some possible approaches:
1. Estimate by reasoning about the sizes of parts. One quick way to arrive at an estimate here is to reason that if all the bars were the same height, each of the four people would have collected one-fourth or 25% of the total. Since Edie’s bar is the shortest of the four, it makes sense to say that Edie collected less than 25% of the total. One way to see that this must be true is by thinking about a pie chart representation like this:
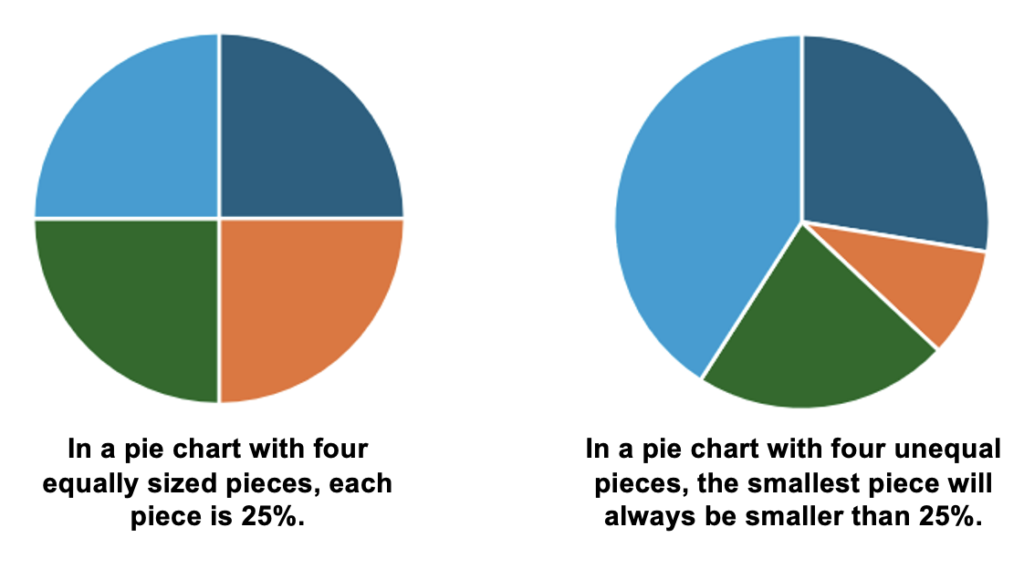
(Note that the second pie chart does not represent the numbers in this question. It only shows what it can look like when you have a pie chart with four unequal pieces.)
If the pie chart doesn’t convince you, try this instead: Try to come up with a set of four different percents that add up to 100% with none of them being smaller than 25%. Can you do it? Why or why not?
Knowing that Edie collected less than 25% of the books eliminates two answer choices!
2. Estimate the total number of books and how many Edie collected. Some students might be frustrated with not being able to pin down precisely how many books each person collected because it might seem like that information is necessary to answer the question. But in this case, estimation is good enough, and the question stem even uses the language of estimation, asking for “About what percent …” instead of for an exact answer. Here’s a nice way of getting an estimate of the sum using estimation vocabulary:
Alex collected a little more than 40 books.
Drew collected a little less than 100 books.
Edie collected a little more than 20 books.
Isaac collected a little less than 40 books.
Since some of the numbers are a little over and some are a little under, it’s reasonable to add up the nice round numbers and call that an approximate total. So all together, they collected about 200 books. The fraction of the books Edie collected is about 20/200.
How might a student then use that fraction to select an answer choice when the answer choices are all percents? Here are a couple ideas:
- 20 out of 100 is 20%, so 20 out of 200 is a smaller piece, so the answer is less than 20%. (In other words, 20 is a smaller piece of 200 than it is of 100.)
- Since percents are hundredths, we could try to convert the fraction 20/200 into a fraction that has a denominator of 100 by using equivalent fractions:
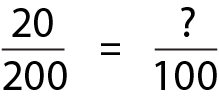
There are lots of other ways you might reason about it. What makes sense to you? (If your approach involves steps you remember or tricks like crossing out zeroes, challenge yourself to make sense conceptually of your strategy.)
3. Visualize chunks in the graph. The horizontal lines in the graph make it possible to visually chunk up the data to see about what fraction of the books Edie collected. A student might chunk up the data into pieces that are about the same size like this:
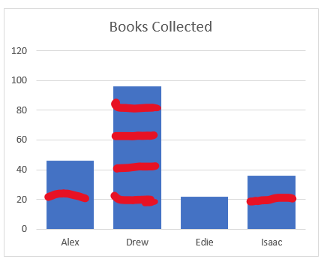
Even without paying attention to the specific numbers in the task, this quick and approximate chunking of the data shows that the books Edie collected are about one out of ten equal pieces.
Bonus tasks: There are many other questions that can be asked about a data display like the one in this task. For example, you could ask what percent the other people collected, or you could ask how many times as many books Drew collected as Alex. What other questions could you ask and answer with this data display? Can you adapt any of the strategies above to other questions?
When exploring a task like this with your students, there are some other questions you can ask which may not have to do with finding the answer, but which will be valuable for students to internalize for when they encounter data displays outside of test situations. The story in this question is fairly simple and a bit contrived, but when we encounter data displays in the real world, they are often more complicated and may be connected to things about which we have strong opinions or biases. We need to develop skills for interrogating data displays so that we are not vulnerable to being manipulated. Here are some other questions that are good to get in the habit of asking:
- Who made this data display?
- What story are they highlighting or focusing on?
- What choices did they make in creating this display?
- What information is missing?
- How else might this data be communicated?

Aren Lew has worked in the field of adult numeracy for over ten years, both as a classroom teacher and providing professional development for math and numeracy teachers. They are a consultant for theSABES Mathematics and Adult Numeracy Curriculum & Instruction PD Team at TERC where they develop and facilitate trainings and workshops and coach numeracy teachers. They are the treasurer for the Adult Numeracy Network.