Will This Be on the Test? (April 2025)
by Aren Lew
Welcome to the latest installment of our monthly series, “Will This Be on the Test?” Each month, we’ll feature a new question similar to something adult learners might see on a high school equivalency test and a discussion of how one might go about tackling the problem conceptually.
Welcome back to our continuing exploration of how to bring real conceptual reasoning to questions students might encounter on a standardized test.
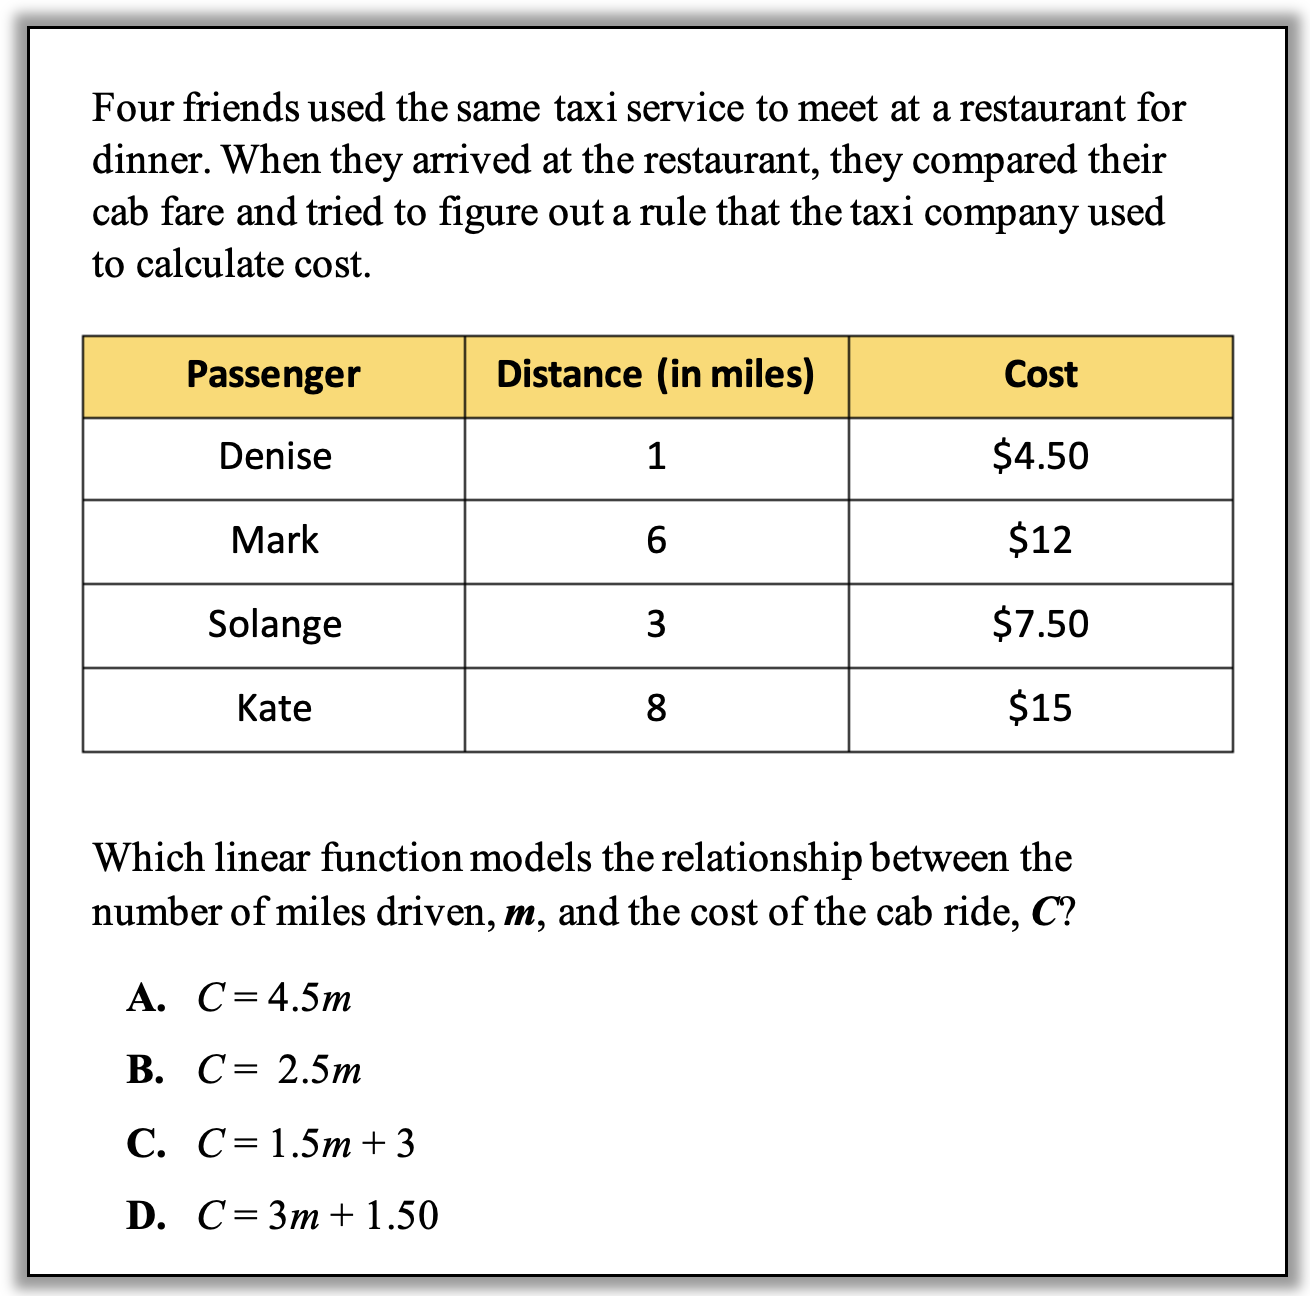
This month’s task comes from HSE Practice Test Questions based on the Taxi Cab Problem, part of the excellent collection of resources for adult ed teachers at CollectEdNY. The original task this question is based on is found in Unit 2 of the CUNY Math Framework.


How can you approach this question in a way that makes sense to you? What conceptual understandings or visual tools can you bring to bear? What mathematical concepts do students really need to be able to tackle this problem? How might your real-world experience help you reason about this?
This is a task that won’t be accessible to every student. A student who hasn’t learned about representing relationships between variables with equations will not have a way in to this because of the abstract notation, but if the notation doesn’t get in their way, there are lots of ways to find the answer.
Here are some possible approaches:
1. Ask: Is this a proportional relationship? (Or is this a question of multiplying?) Two of the answer choices suggest that you can get the cost (C) by multiplying the miles by some number. This suggests that the relationship between cost and miles is a proportional relationship. This would mean that, for example, a ride that is twice as long would cost twice as much. But look at Mark’s ride and Solange’s ride… Mark rode twice as far as Solange, but his total cost was less than twice as much. There’s something else going on here.
You might also notice that in Mark’s ride, the number of dollars he paid (12) is exactly twice the number of miles he rode (6). If the rule that gives us the cost of a ride was that we multiply the miles by some number, that would be true of everyone else’s ride as well, but it isn’t. So, again, there is something going on here besides multiplying.
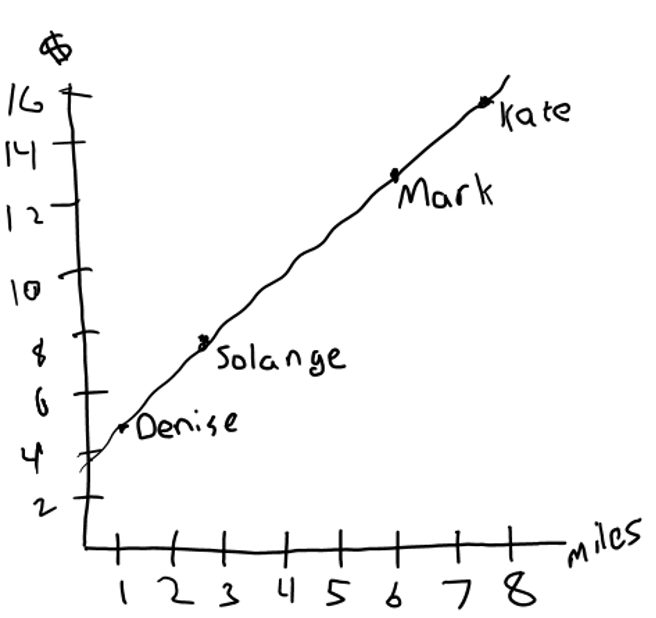
2. Sketch a graph and estimate the y-intercept. A student who knows that a linear equation has a slope and a y-intercept and has already realized that the answer cannot be an equation that shows a purely multiplicative relationship may realize that they can figure out which of the two remaining answer choices is correct by sketching a quick graph and estimating the y-intercept. A good strategy when sketching a graph based on a table is to note the range of numbers for each coordinate. In this case, the miles (horizontal axis) only go up to 8, whereas the dollar (vertical axis) go up to 15, so the axes will have to be long enough to show those values. It’s not necessary to use the same scale on both axes, just to be consistent with each one. A sketch could look like this:

Based on this sketch, can you identify which remaining answer choice must be correct by estimating the y-intercept?
(It is also possible to use a sketch to estimate the slope. In my opinion, estimating the y-intercept is an “easier” strategy in this case for two reasons: 1) The slopes in the answer choices are given as decimals, so there is extra work in interpreting them as ratios, and 2) When using a sketch of a graph to estimate slope, the slope can be harder to recognize if you don’t use the same scale on both axes.)
3. Figure out the rate per mile or slope by comparing two rides. Because when Denise, Mark, Solange, and Kate met for dinner, they did not know very much about the rule the tax company used to calculate the cost of the ride, they probably needed all four data points to figure it out. However, in the context of a multiple choice question where every answer choice is a linear equation, we already know the relationship is linear. That means we only need two points to figure out the slope or the rate per mile. Which two points seem most accessible to you? I notice that Kate’s ride was 2 miles longer than Mark’s and cost $3 more. What does that tell me about the rate?
4. Check the answer choices, but be efficient. A strategy that works for many multiple choice questions is to evaluate each answer choice, but if we think about what is reasonable, we can often figure out the correct option without completely working through every choice. In this case, we could eliminate two choices just by recognizing that the relationship is not proportional. The remaining two choices represent two different scenarios that can be evaluated by going back to the context. Answer choice C says that the rate per mile is $1.50, and the base cost of the ride is $3. Answer choice D says the opposite. A student could evaluate the cost per mile as described in strategy 3 or could look for other indications in the table that one is correct or not correct. For example, Mark’s ride was 6 miles and cost $12; if the cost per mile was $3.00, his ride would have cost more than $18, so that can’t be the answer. How else could you check an answer choice without doing a lot of computation?
In the Standards for Mathematical Practice, the second standard (MP.2) is “Reason abstractly and quantitatively.” It took me some effort to make sense of this one for myself. Here’s some of the language from it: “Mathematically proficient students … bring two complementary abilities to bear on problems involving quantitative relationships: the ability to decontextualize—to abstract a given situation and represent it symbolically and manipulate the representing symbols as if they have a life of their own, without necessarily attending to their referents—and the ability to contextualize, to pause as needed during the manipulation process in order to probe into the referents for the symbols involved.” What this means to me is that it is valuable to be able to write an equation to describe a situation without losing track of the situation itself. Decontextualizing is writing the equation with symbols. Contextualizing is connecting the equation back to the situation. Where do you see MP.2 at work in this task and in these strategies?
It is common to see fluency with symbols and equations lifted up as the goal of math education, but symbols and equations are tools for reasoning about the world, and being able to make sense of the world is the bigger prize. We can use tasks like this to strengthen our understanding of the connections between symbols and the situations they describe so that symbolic algebra becomes one tool of many in our mathematical toolboxes.

Aren Lew has worked in the field of adult numeracy for over ten years, both as a classroom teacher and providing professional development for math and numeracy teachers. They are a consultant for the SABES Mathematics and Adult Numeracy Curriculum & Instruction PD Team at TERC where they develop and facilitate trainings and workshops and coach numeracy teachers. They are the treasurer for the Adult Numeracy Network.
