Will This Be on the Test? (May 2024)
by Sarah Lonberg-Lew
Welcome to the latest installment of our monthly series, “Will This Be on the Test?” Each month, we’ll feature a new question similar to something adult learners might see on a high school equivalency test and a discussion of how one might go about tackling the problem conceptually.
Welcome back to our continuing exploration of how to bring real conceptual reasoning to questions students might encounter on a standardized test.
One common experience for adult numeracy teachers, and one I’ve had myself on multiple occasions, is a student returning after having taken a test and saying, “There was a problem on [insert topic here] and you never taught us how to do that!” It’s easy to take away from this a sense of urgency to teach that particular topic—after all, it is on the test and the student wants to learn about it. However, a topic showing up on the test is not sufficient justification for teaching students material for which they have not yet built a foundation. It is much more useful to be transparent with students about the fact that they will see things on the test that they haven’t seen before. Sometimes they will be able to figure them out and sometimes it’s best to just take a guess on those questions and spend the extra time on something they can figure out. (See the October 2021 installment of Will This Be on the Test for more on this.)
Maybe there’s something in the stars, or maybe just on the tests, but I’ve had several teachers say to me recently that they’ve had that experience with a student and that the topic of concern was slope. While I wouldn’t recommend jumping to teaching about slope if it is not appropriate, it seems worth exploring whether this is a topic that can be approached flexibly and creatively. (Spoiler alert: It can!)
With that in mind, here is this month’s question:
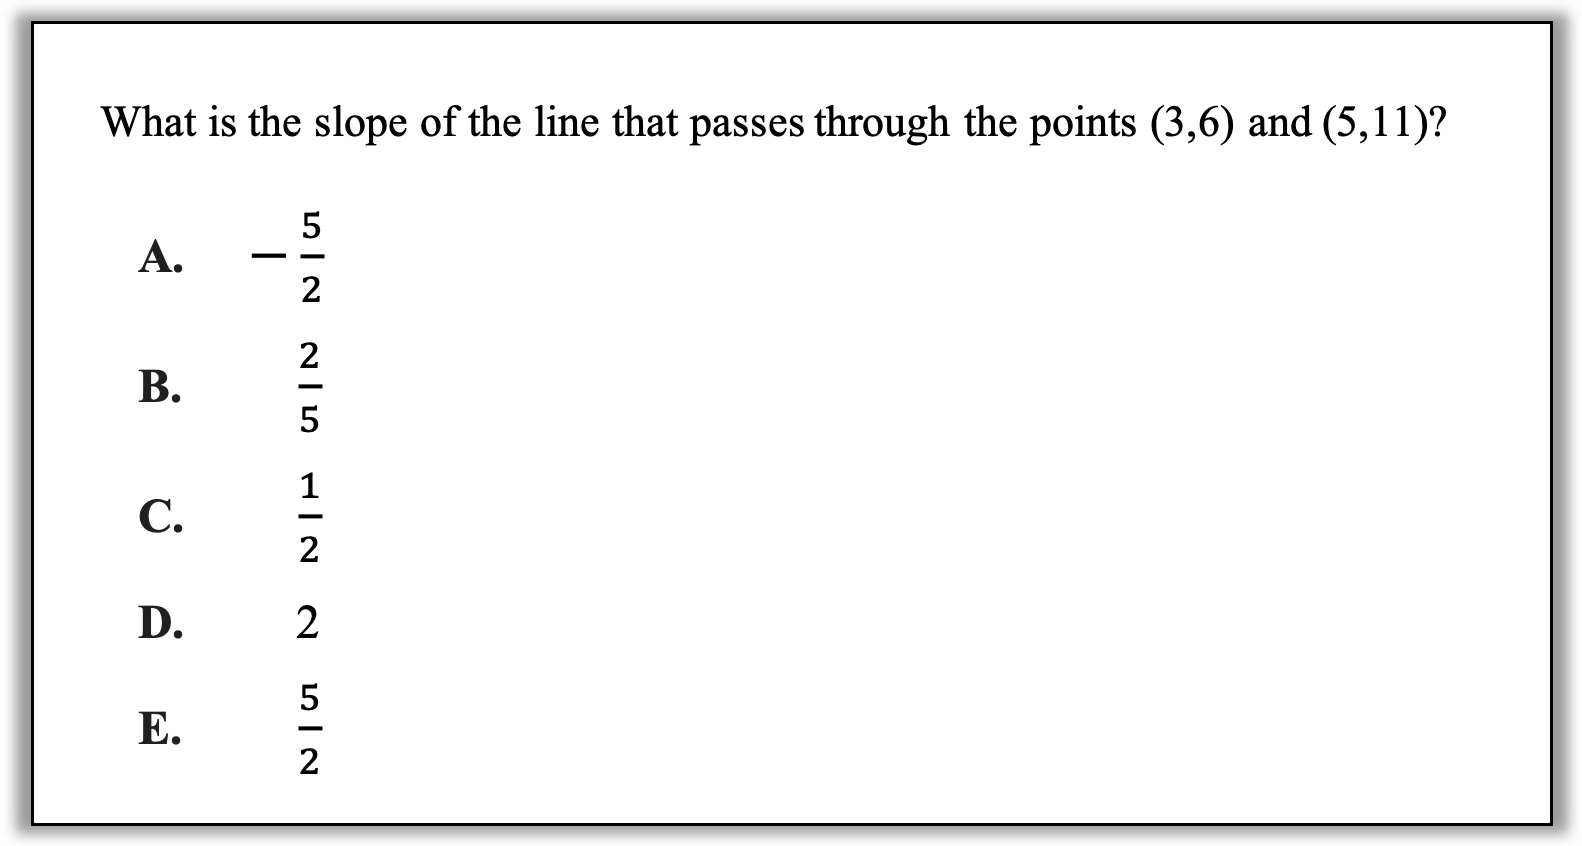
How can you approach this question in a way that makes sense to you? What conceptual understandings or visual tools can you bring to bear? What mathematical concepts do students really need to be able to tackle this problem? How might your real-world experience help you reason about this?
In many cases, students can tackle unfamiliar questions without having formally learned about the question topic. In this case, however, if a student has not learned about plotting points with coordinates and does not have a basic understanding of the mathematical meaning of slope, this question will not be accessible. But what does it mean to have a basic understanding of the mathematical meaning of slope? There’s a lot more to slope than the formula!
Here are some approaches to finding slope that do not require using a formula. As you read through them, consider what understandings are required to navigate this question.
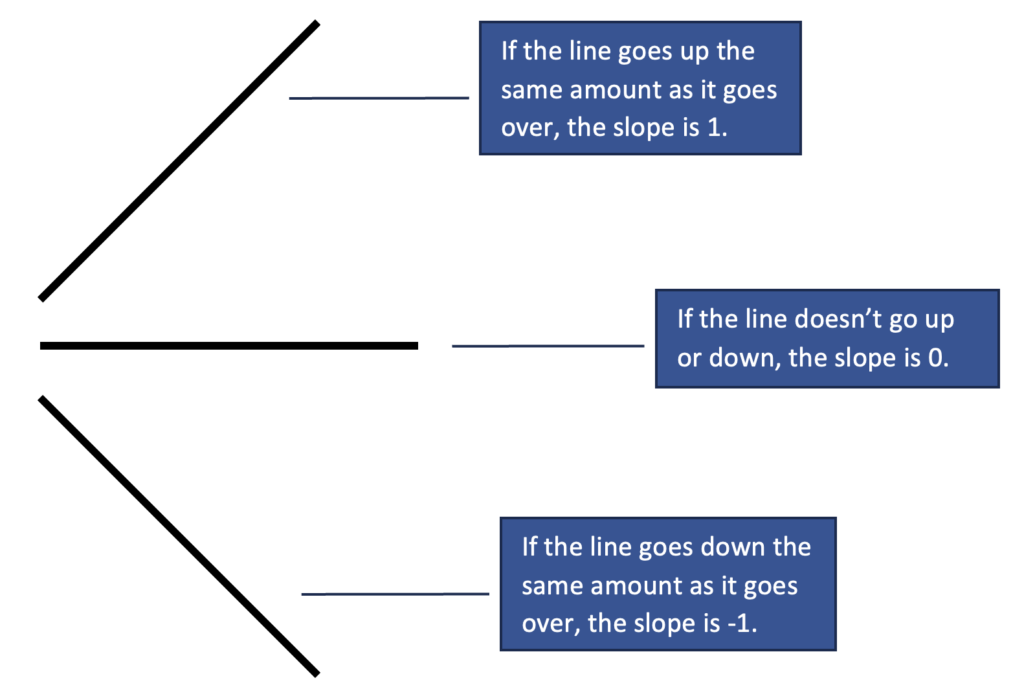
1. Use benchmarks. Estimate with a quick sketch. One helpful understanding about slope is that slope is a measure of how far up or down a line goes as you look at it from left to right. This understanding makes it possible to set up some benchmarks. Before learning formally how to find slopes, students might become familiar with some benchmarks like these:
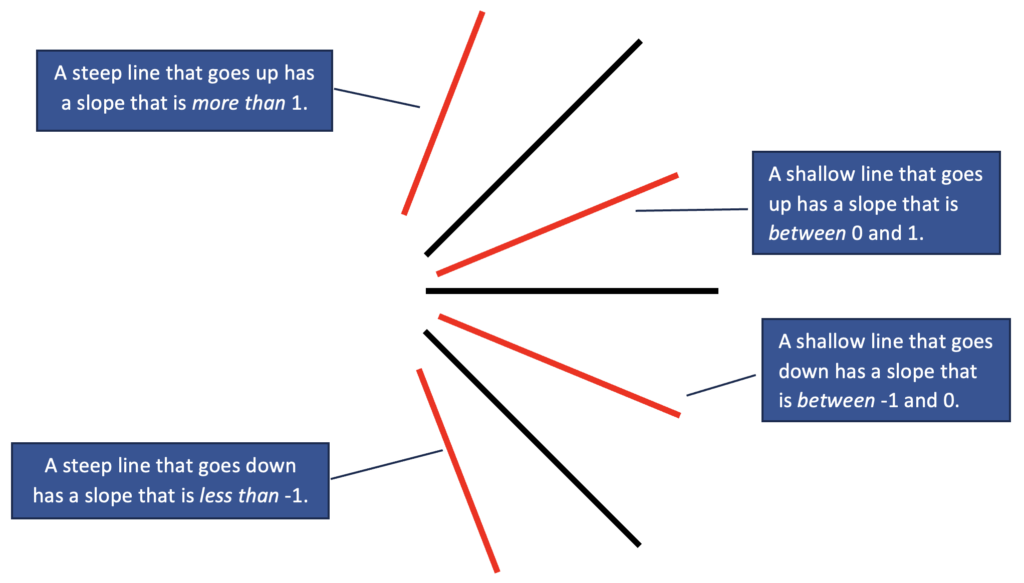
And when you know benchmarks for slope, just like with fractions, you can use them to draw conclusions about slopes that are between them, like this:
As with other kinds of benchmarks, these grow and develop over time and become benchmarks through using and understanding them. Knowing some benchmarks for slope and making use of the answer choices, a student might draw a quick sketch like this:
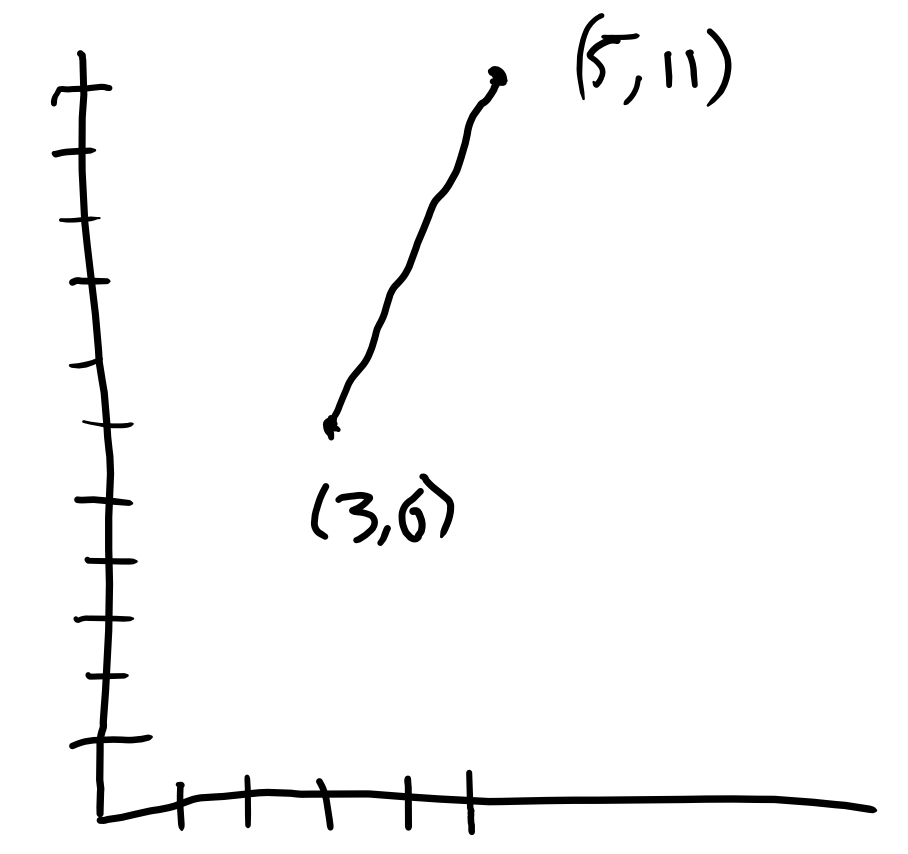
What characteristics of the slope of this line are evident from this sketch? (Positive? Negative? Steep? Shallow?) What answer choices could be eliminated?
2. Draw a triangle to help figure out the vertical and horizontal change. To be more precise, a student might complete the triangle in the sketch like this:
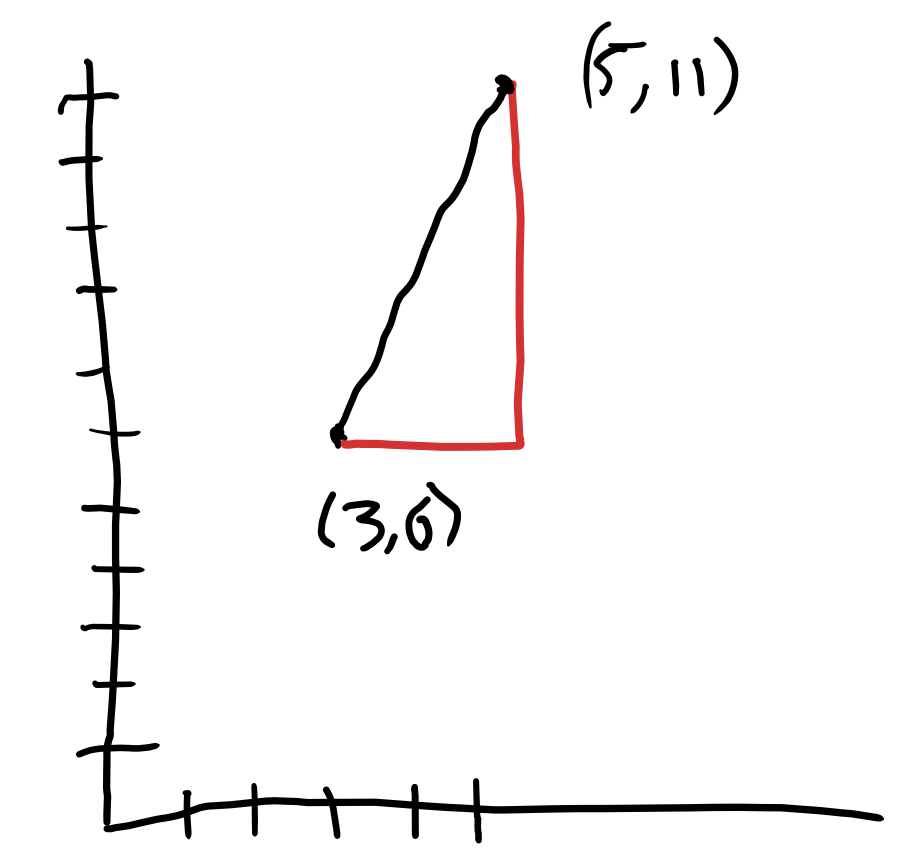
What understandings would a student need to be able to figure out the lengths of the sides of the triangle? This line appears “steep”—how does that connect to how the height and the base of the triangle are related? Before they learn a formula, students could be encouraged to consider questions like this. What relationships of base and height create steep slopes? What relationships create shallow slopes?
3. Reason about up and over. A student who is confident with making sense of coordinates may consider the question of how far up versus how far over in the abstract, reasoning about the change in the x‑coordinates and the change in the y-coordinates without plotting the points like this:
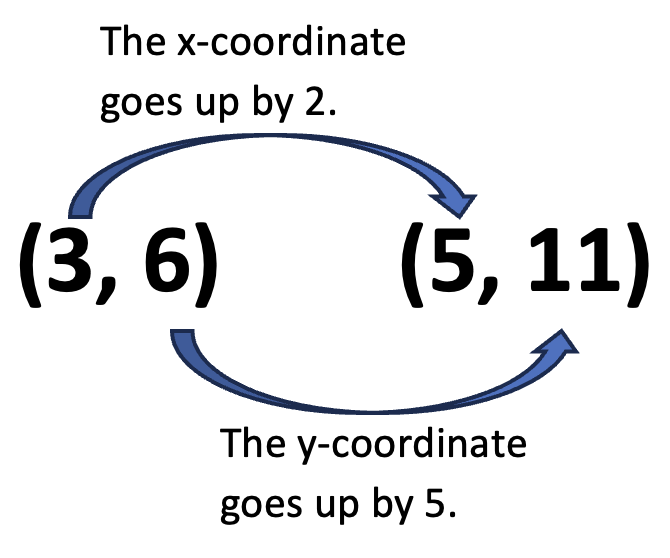
Note that students who have only been taught to think of slope with a formula (even if that formula is simplified as “rise over run”) can easily get their slopes “upside-down”. In this problem, they might interpret the slope as 2/5 instead of 5/2. A combination of knowing benchmarks and reasoning visually makes this much less likely.
4. Create a context. The second Standard for Mathematical Practice (in the College and Career Readiness Standards for Adult Education) is “Reason abstractly and quantitatively.” This standard calls out that mathematically proficient students can decontextualize or represent a concrete situation abstractly using symbols and mathematical notation. It also notes that equally important is the ability to contextualize—to pause in symbolic manipulation to make sure everything makes sense in context. Test questions often start out decontextualized, but that doesn’t mean that applying a context couldn’t still be helpful. For example, a student who understands that slopes often represent rates might interpret the points given in the question in a context of dollars and hours like this:
After 3 hours, I had made $6, and after 5 hours I had made $11. How much did I earn per hour in the time between those two points?
The total amount of money I earned was $5 and the total amount of time I worked was 2 hours, so I earned $2.50 per hour during that time.
Applying context to decontextualized problems is a good practice in general. It is challenging, but it builds strong conceptual understanding and becomes a powerful tool for sense-making. (Note that with this strategy, it is important to focus on the interval between the two points.)
Teaching about slope is more than teaching how to find it. Here are some fundamental ideas about slope that can be developed through conceptual teaching:
- Slope is a measure of how steep a straight line is.
- Slope is a way of talking about steepness that involves comparing vertical change and horizontal change (instead of measuring steepness as an angle).
- Slope has meaning in context. It often is a way of talking about rate (for example comparing change in miles to change in hours or comparing change in items sold to change in money made).
- Slopes can be positive (going up from left to right) or negative (going down from left to right).
- There are other options for when lines don’t go up or down or don’t go left to right.
- Some slopes are easier to recognize than others. Slopes of -1, 0, and 1 are good benchmarks.
Even these fundamental ideas are not necessarily the best place to start with slope. Slope is the answer to a question—the question of how fast something is changing and whether it is going up or down. This is a question that comes up in so many contexts:
- How does the amount of money you make change as the number of hours you work increases?
- How does the amount of gas in your tank change as the number of miles you drive increases?
- How does the amount of water in the tub change as the amount of time the tap is on increases?
- How does the number of people who can sit at a table change as the number of tables pushed together changes? (See the EMPower™ series: Seeking Patterns Building Rules Lesson 2 for a great activity exploring this context. The idea of slope is developed throughout the lessons in the book, moving from an informal introduction of the term in lesson 4 to more formal calculations by lesson 10. Even if you aren’t planning to do all those lessons, reading through them to see how the concept develops may be helpful)
By investigating situations where there is a constant ratio between the change in one quantity and the change in another, students will develop the concept of rate of change and find they have an intellectual need to have a name for it. Visualizing that relationship on a graph, naming it, and finding strategies to find in in decontextualized situations will come much more easily when students have constructed a concept to attach this more abstract information to.

Sarah Lonberg-Lew has been teaching and tutoring math in one form or another since college. She has worked with students ranging in age from 7 to 70, but currently focuses on adult basic education and high school equivalency. Sarah’s work with the SABES Mathematics and Adult Numeracy Curriculum & Instruction PD Center at TERC includes developing and facilitating trainings and assisting programs with curriculum development. She is the treasurer for the Adult Numeracy Network.