Facebook or Instagram? Teens Explore Data About Technology Use
FEATURE // BY ANDEE RUBIN
Data science has caused a major shift in how scientists from all disciplines approach their research. Data analysis tools are as central to modern science as a lab bench and Bunsen burner. As schools prepare the next generations of scientists, logically we should be seeing a seismic shift toward teaching data science in STEM classrooms. Yet this is not happening, as data science doesn’t fit clearly into the disciplines around which the curriculum is currently organized.
To bridge this gap, informal settings will be critical in preparing youth for a data-intensive future, at least in the near term. TERC, together with Science Education Solutions, is studying how to introduce middle school students, especially girls and rural youth, to data science through Data Clubs activities designed for after-school or summer camp programs. Funded by the NSF STEM+C program, the Data Clubs team is partnering with community organizations to offer 10-hour Data Clubs modules; TERC’s community partners are the Malden, MA, YMCA and the local chapter of Girls Inc.
To design our modules, the Data Clubs team started by deciding on criteria in four categories: topics, datasets, tool, and activities.
Topics: We wanted the topics of our modules to be both a “window” and a “mirror” for participants; that is, to provide a window into the experiences of others, as well as a mirror of the students’ own reality. We looked for topics that were familiar to students, so that they could contribute data about their own lives, but we also wanted students to discover the variety of experiences people have, as this variability is at the heart of data science.
Datasets: The rise of data science is at least partly due to the ease of generating and sharing large data sets, so for the centerpiece of each module we used a “big data” set that is publicly available. Big data sets by definition have a large amount of information and are often quite complex. Much like Goldilocks looking for a comfortable chair, we had to find data sets that were “just the right size”; we customized each data set to make it accessible to middle school students by limiting its size, but making sure there were still interesting patterns for students to discover in the data.
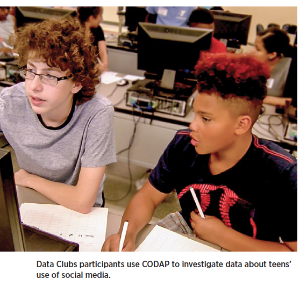
Tool: We wanted to use a data analysis tool that would make data exploration and graph construction easy, so that participants could focus on making meaning of the data, rather than on spending time learning how to use the tool. CODAP (Common Online Data Analysis Platform, https://codap.concord.org) works well in this regard. It is freely available, web-based, and designed for students in Grades 6-14. Even novice users can make graphs easily, so they can explore a variety of relationships quickly and fluidly.
Activities: While the bulk of time in each module is spent analyzing data using CODAP, we interspersed non-computer activities in many sessions. In particular, we felt it was important for students to have an opportunity to collect their own data related to the module topic. The insights students gain from collecting their own data are less likely to arise when the data to be analyzed have been already collected by someone else.
Teens and Technology
The first module we developed and tested dealt with teens’ use of technology. This topic (not surprisingly) had great appeal for middle schoolers. Technology plays a big role in teens’ lives. Much of their interaction with the world is conducted through social media, and they are familiar with both its advantages and pitfalls. This topic easily met our criterion for a module topic, as it gave students a chance to compare their own social media usage (mirror) to other people’s usage reflected in the dataset (window).
In the summer of 2018, almost two dozen middle schoolage participants showed up for our first club at Malden High School to explore data about Teens and Technology. We introduced them to a dataset that the Pew Research Center collected in 2014, asking teenagers about their use of technology, especially video games and social media.
One of Pew’s focal areas is Internet and Technology (pewinternet.org); the Pew team collects data from American families on this topic multiple times a year, writes analytical reports on trends in the data, and then makes the data public — but the data are only made available 2 to 3 years after they are collected.
The Pew dataset is truly big, consisting of responses from over 1000 people to several hundred questions. From this dataset, we chose a small subset of questions that had interesting relationships among them and a random set of 200 people’s responses. Then we presented the Club with the graph below of teens’ answers to the question: “Which social media do you use most?” Each dot in the graph represents a single person’s response.
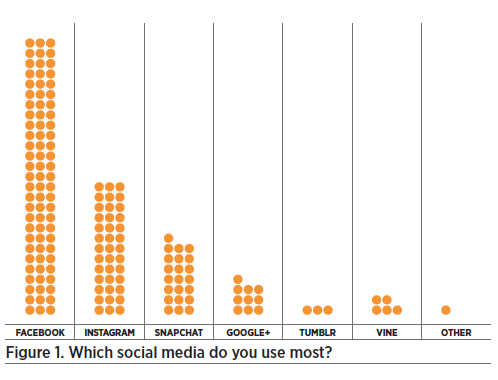
Club participants’ first response to the data was, “Wait, that’s not right! Our friends don’t use Facebook; they all use Instagram and Snapchat. Only our parents use Facebook!”. The conversations that followed provided a good example of the kind of inquiry we would want our students to cultivate as future data scientists. They wanted to know the story behind the data: “Who did the researchers ask?”, “How was the question phrased?”, and “When were these data collected?”
When the Club facilitator said that the data were collected in 2014, the mystery was solved. Clearly, these were old data!
Participants noted that social media use changes quickly, often over a period as short as a year or two. To look into this phenomenon further, the teens used CODAP to see if there was a relationship between age and social media use. They wondered if older teens use different social media than younger ones. Starting with Figure 1, and adding “age” on the Y-axis, Club participants produced the following graph:
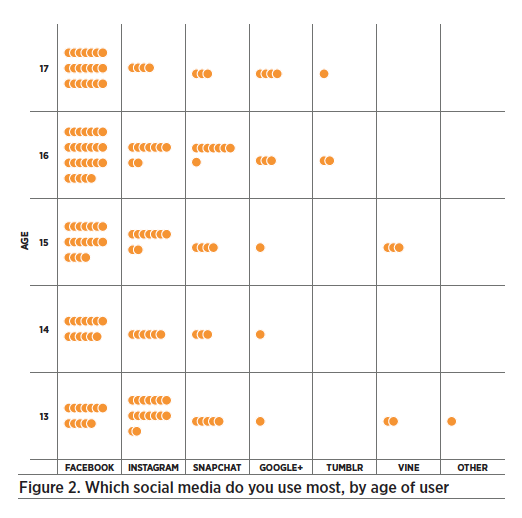
The graph showed them that 16 and 17-year-olds are more likely to use Facebook than 13-year-olds, and that Instagram is more popular among 13-year-olds. Participants had a wellreasoned explanation for why this difference exists: Since Facebook was more popular several years ago, older teens started using it and didn’t change their habits as time went on. Younger teens, on the other hand, starting using social media when Facebook was already in decline, so they started with Instagram.
As the module progressed over two weeks, participants explored many relationships among the variables in the data set. Several participants were drawn to explore gender differences in technology use, especially around video games. While the participant group was approximately half male and half female, there were some single-gender groups who hung out together during the sessions. One group of boys was interested in whether the data showed that boys played video games more than girls, so they created the graph in Figure 3, in which each dot is colored according to the gender of the respondent:
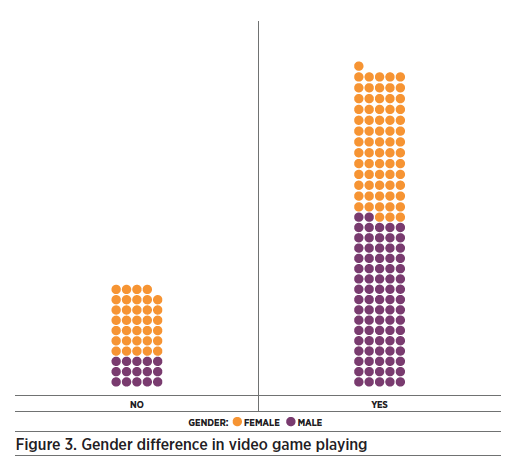
This group was surprised by how many girls do, in fact, play video games, but they noted correctly that, proportionally, boys in this dataset were more likely than girls to play video games.
Because participants had noticed immediately that the Pew data were old, and thus probably not representative of current trends of technology use by teens, they decided to collect data from their own peer group to compare with the Pew data.
While their sample size was very small compared to the Pew sample, some of the differences were striking. Indeed, among their own friends, Facebook was a distant third to Instagram and Snapchat in terms of social media use.
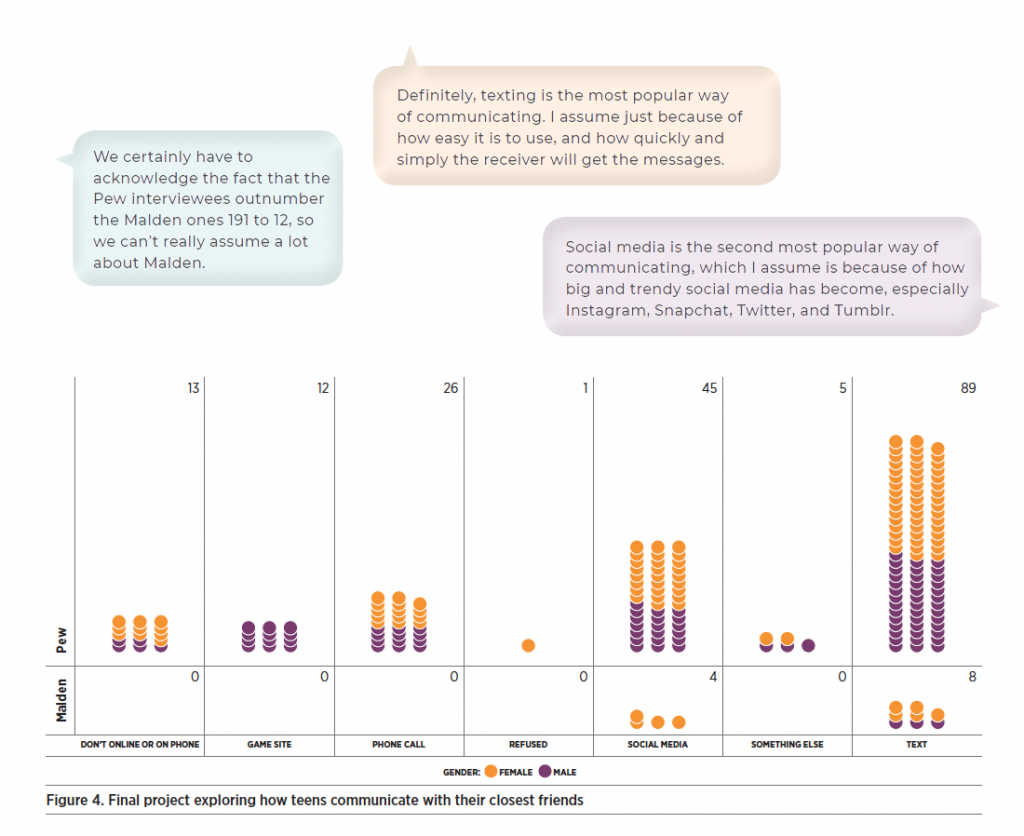
After several sessions in which we suggested questions, participants struck out on their own, choosing their own investigations for a final project. During the last two-hour session, they explored the variables they found particularly interesting and chose a graph that showed a relationship that made sense to them. They then built a final presentation by adding explanatory text to the graph. Several participants chose to include the comparison between the online data (Pew) and their own data (Malden), as well as continuing to investigate gender differences. The final project illustrated in Figure 4 investigated how teens talk to their closest friend, looking at differences between the Pew and Malden data as well as differences across gender. The text bubbles were added using the text function in CODAP.
Data Clubs 2019
In the Summer of 2019, we’ll be offering a second Data Clubs module in Malden using data on the occurrence of Lyme disease and other tick-borne illnesses. Data includes stateby- state rates of Lyme disease from the Centers for Disease Control and a variety of climate variables such as summer high and low temperatures and annual rainfall. Students will explore where Lyme is increasing and what environmental factors might be related to this phenomenon. We will also be trying out new instruments to assess participants’ dispositions toward data analysis and their understanding of basic principles of data science.
AUTHOR
Andee Rubin is a mathematician and computer scientist at TERC who has been combining expertise in technology design, math education, and artificial intelligence to improve math and science education both in and out of school for over 30 years. This work was supported by National Science Foundation award DRL-1742255. The author gratefully acknowledges other members of the Data Clubs team: Tracey Wright and Traci Higgins at TERC, Jan Mokros (co-PI) at Science Education Solutions, Meggie Harvey, Christine Voyer, and Leigh Peake at the Gulf of Maine Research Institute, and Elizabeth Osche at PERG.
Watch Andee present her findings at https://bit.ly/2U0kxZl